7 Tips to Understand the Wastewater Treatment Plant Process
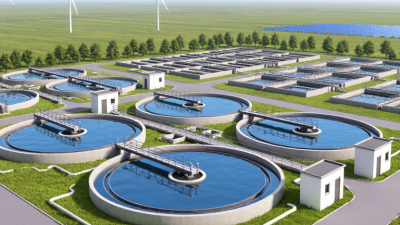
Understanding the wastewater treatment plant process begins with seeing what happens after wastewater leaves homes, businesses, and industrial facilities. It does not simply disappear. It travels through pipes toward a plant where operators remove solids, organic matter, nutrients, and harmful microorganisms. Each stage has a distinct purpose, but real systems rarely operate as neatly as textbook diagrams suggest.
These seven practical tips will help readers follow the journey from inlet screening to final discharge or reuse. You will examine coarse screens that capture wipes and plastics, grit chambers where sand settles, and biological tanks filled with carefully managed microorganisms. You will also see how clarifiers separate sludge from treated water. Small details matter, such as rising bubbles, changing odors, foam on a tank surface, and daily laboratory samples. They can reveal whether a process is stable or needs attention.
Treatment requires engineering knowledge, reliable monitoring, and experienced operators. Flow rates change after storms. Industrial discharges can upset biological systems. Equipment can fail at inconvenient times. No plant runs perfectly.
That matters.
A responsible explanation should acknowledge uncertainty instead of promising effortless results. Regulations, treatment technologies, and discharge limits vary by location, so professional guidance remains essential. The following tips provide a clear foundation, while encouraging readers to question assumptions and look more closely at plant performance. By connecting each treatment stage with its practical purpose, the wastewater treatment plant process becomes easier to understand, evaluate, and discuss with confidence.
Map Influent Screening: Remove Debris with 6–10 mm Bar Screens
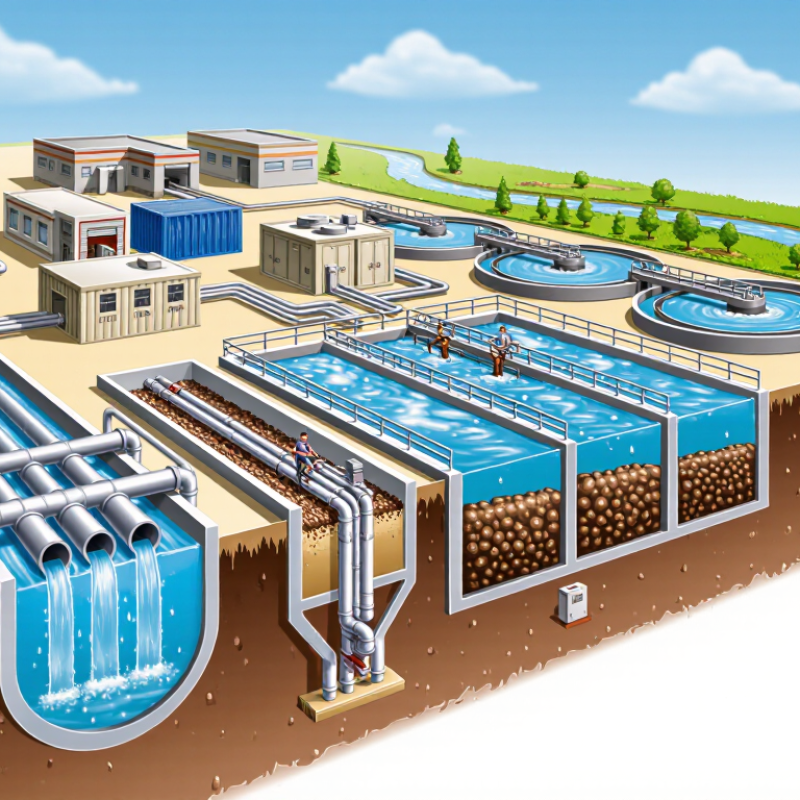
Tip: Start with the influent channel, not the screen itself. Flow carries rags, plastics, grit, and food waste toward the headworks. A 6–10 mm bar screen catches large debris before it damages pumps or blocks downstream equipment. The United States Environmental Protection Agency identifies preliminary treatment as essential for protecting mechanical systems. In field inspections, wet screenings often look harmless, but they can hide stones, wires, and tangled textiles. Keep the walkway visible. That detail matters.
Tip: Map each screen’s location, spacing, approach channel, and discharge route. Record headloss before and after cleaning. A rising water level upstream usually signals blinding, poor raking, or excessive solids loading. The 2024 WHO/UNICEF Joint Monitoring Programme report estimates that 3.4 billion people lacked safely managed sanitation in 2022. That global gap increases pressure on treatment plants to operate reliably, even when influent quality changes sharply after storms.
Do not trust one reading. A screen can appear clean and still restrict flow. Operators should photograph debris types, weigh screenings when practical, and compare daily volumes with rainfall data. Tip: leave room for judgment. Six millimetres may protect sensitive equipment, but it can also increase maintenance frequency. Ten millimetres may reduce cleaning, yet smaller plastics can pass through. The right opening depends on pumps, channel velocity, staffing, and local loading. This choice is not perfectly standardized.
Balance Flow and Grit: Provide 2–5 Minutes of Hydraulic Retention
In a wastewater treatment plant, grit removal depends on controlled flow, not simply a large tank. A hydraulic retention time of two to five minutes gives sand, gravel, and other dense particles enough time to settle. Lighter organic solids should remain suspended and continue downstream. The basic check is simple: retention time equals tank volume divided by flow rate. Measure it at average and peak conditions.
Flow changes can upset this balance quickly. During a storm, excessive velocity may carry grit into pumps, channels, or biological tanks. At low flow, particles may settle in unwanted areas and create odors. Operators should inspect the chamber, review flow records, and verify velocity near the inlet and outlet. A target near 0.3 meters per second is commonly used in horizontal grit systems, but the actual design must match particle size and process geometry. Small details matter.
A clean spreadsheet can still mislead. Baffles, uneven channels, debris, and short-circuiting may reduce the real retention time. Dye testing or careful field observation can reveal these problems. Adjusting gates or removing accumulated grit may restore performance before major maintenance is needed. Do not treat two to five minutes as a universal rule. Confirm the result with site data, equipment limits, and qualified engineering review.
Control Biological Treatment: Maintain 2–4 mg/L DO for BOD₅ Removal
In an activated sludge basin, dissolved oxygen (DO) controls how well microorganisms remove BOD₅. A practical operating range is 2–4 mg/L. This level usually supports aerobic activity without wasting excessive energy on aeration.
Operators should check DO at several points, not only near the probe. Near the air inlet, readings may look high while the far end remains oxygen-starved. Watch the basin during peak flow. Foam, rising sludge, or a sour odor can signal unstable conditions. Keep probes clean and calibrated, because a dirty sensor can quietly mislead the entire operation. Small mistakes matter.
Airflow should change with oxygen demand, temperature, and incoming BOD₅. If DO falls below 2 mg/L for long periods, carbon removal may slow and filamentous growth may increase. If DO stays above 4 mg/L, treatment may remain effective, but electricity use can rise unnecessarily. I have seen operators chase a perfect number and overlook uneven mixing. Biology rarely behaves perfectly. Review DO trends, sludge age, return rates, and laboratory BOD₅ results together. A single reading cannot explain the whole process.
Polish Effluent: Achieve Typical Limits of 30 mg/L BOD₅ and TSS
Polishing effluent to typical limits of 30 mg/L BOD₅ and 30 mg/L TSS requires steady control, not one dramatic treatment step. These values can vary by permit, discharge location, and sampling method. Operators should verify local requirements before changing process targets. BOD₅ indicates biodegradable organic matter, while TSS measures suspended particles that make water cloudy.
Equalize incoming flow when possible, because sudden hydraulic surges can disturb biological treatment. Keep aeration stable and check dissolved oxygen at different basin locations. Biological organisms need suitable oxygen, temperature, and contact time. Watch the secondary clarifier closely; rising sludge, short-circuiting, or poor settling can quickly increase TSS. A clear surface can still hide weak performance.
Small details matter. Calibrate flow meters and test equipment on schedule. Compare laboratory results with field observations, including foam, color, odor, and sludge texture. Filtration can remove remaining solids, but overloaded filters may send trapped material back into the effluent. Chemical assistance may improve clarification, yet excessive dosing creates cost and sludge problems. Inspect pumps, air lines, scrapers, and return-sludge controls before failure occurs. Keep records that connect each adjustment with BOD₅ and TSS results. Real plants are rarely tidy. A rushed correction may solve today’s sample and weaken tomorrow’s stability. One practical lesson is easy to miss: operators should investigate trends, not chase a single test result.
Stabilize Waste Sludge: Thicken Biosolids to 20–30% Total Solids
A wastewater treatment plant becomes easier to understand when you follow the sludge. After biological treatment, excess biosolids contain large amounts of water, often above 98 percent. Stabilization reduces odors, pathogens, and uncontrolled decomposition. Thickening removes some water before digestion, conditioning, or mechanical dewatering.
At 20–30 percent total solids, biosolids are usually dewatered rather than simply thickened. This distinction matters. A gravity thickener may produce only 3–8 percent solids, while a belt press, centrifuge, or screw press can reach the higher range. Operators should measure total solids from representative samples, not rely on appearance. A dark, firm cake can still hold too much water.
Small details change performance. Keep polymer preparation consistent, and check mixing energy during conditioning. Watch filtrate clarity, cake texture, torque, and feed pressure. Adjust one setting at a time. Sudden changes can hide the real cause. Temperature also affects viscosity and biological activity. In cold weather, the same equipment may need slower loading. Conveyors should move cake without excessive smearing or pooling. A clean sample tray helps reveal uneven dewatering. Field experience often exposes weaknesses that laboratory tests miss. I have found that operators sometimes chase a higher solids number while overlooking poor capture. That tradeoff can increase water use and return solids to the treatment process. Records should connect each adjustment with laboratory results, equipment readings, and actual cake handling.
7 Tips to Understand the Wastewater Treatment Plant Process - Stabilize Waste Sludge: Thicken Biosolids to 20–30% Total Solids
| Tip | Process Area | What to Understand | Typical Solids Range | Key Operating Control | Practical Benefit |
|---|---|---|---|---|---|
| 1 | Primary and Waste Activated Sludge | Primary sludge contains settled organic solids, while waste activated sludge contains biological floc generated during secondary treatment. Their settleability and dewaterability can differ significantly. | Approximately 0.5–8% TS before dewatering | Track total solids, volatile solids, sludge age, and feed consistency. | Better process selection and more stable downstream thickening. |
| 2 | Sludge Stabilization | Stabilization reduces readily biodegradable organic matter, odors, and pathogen risks. Common approaches include aerobic digestion, anaerobic digestion, lime stabilization, and other approved treatment processes. | Depends on the stabilization method | Control temperature, oxygen or mixing conditions, retention time, pH, and volatile-solids reduction as applicable. | Improved storage characteristics and reduced nuisance odors. |
| 3 | Gravity or Mechanical Thickening | Thickening removes free water before digestion, dewatering, or transport. Gravity thickeners are commonly used for settleable primary sludge, while rotary drum, dissolved-air flotation, and other mechanical systems can handle biological sludge. | Typically about 2–8% TS after thickening | Maintain appropriate solids loading, polymer dose where used, blanket depth, and overflow clarity. | Reduces sludge volume and lowers the hydraulic load on later treatment units. |
| 4 | Anaerobic Digestion and Biogas Recovery | In anaerobic digestion, microorganisms convert part of the organic matter into biogas, primarily methane and carbon dioxide, under oxygen-free conditions. | Feed commonly around 3–8% TS, depending on system design | Monitor digester temperature, pH, alkalinity, volatile fatty acids, mixing, and gas production. | Stabilized biosolids and potential recovery of renewable energy. |
| 5 | Polymer Conditioning | Conditioning causes fine sludge particles to agglomerate into larger flocs, allowing water to separate more readily during mechanical dewatering. | Optimized by sludge type and equipment | Perform jar testing or dosage trials; avoid underdosing, overdosing, and excessive shear after floc formation. | Improves filtrate quality, cake formation, and solids capture. |
| 6 | Mechanical Dewatering | Belt filter presses, centrifuges, screw presses, and filter presses remove additional water. The achievable solids content depends on sludge characteristics, conditioning, and equipment settings. | Often about 15–30% TS in dewatered cake | Adjust feed rate, differential speed, belt or bowl settings, wash water, pressure, and polymer dose. | Lower hauling costs and easier handling compared with liquid sludge. |
| 7 | Verification, Storage, and Final Use | A target of 20–30% total solids generally describes dewatered biosolids cake rather than conventional thickened sludge. Confirm the final material meets applicable requirements before land application, composting, drying, or disposal. | Target: 20–30% TS for many dewatered cakes | Test total solids, volatile solids, nutrients, pathogens, vector attraction reduction, metals, and other locally regulated parameters. | Supports compliant end use, predictable storage, and reliable solids management. |
Note: Actual solids concentrations vary with sludge source, treatment technology, polymer conditioning, equipment settings, and local regulatory requirements.
Related Posts
-
How to Choose a Waste Water Treatment Plant in 2026
-
What Is a Waste Water Treatment Plant and How Does It Work?
-
What Are the Top China Sewer Treatment Plant Suppliers?
-

How to Choose a Wastewater Treatment Plant in 2026?
-

2026 Top Wastewater Treatment System Innovations to Watch Out For?
-
Top 10 Innovative Waste Water Treatment Plant Technologies You Should Know?